How Shopify Reduced Metrics Resources by 75%
Shopify saved resources by breaking big tools into tiny reusable services
Shopify launched in 2006, and in 2023, made over $7 billion in revenue, with 5.6 million active stores.
That's almost as much as the population of Singapore.
But with so many stores, it's essential to ensure they feel quick to navigate through and don't go down.
So, the team at Shopify created a system from scratch to monitor their infrastructure.
Here's exactly how they did it.
Estimated reading time: 4 minutes 53 seconds
Shopify's Bespoke System
Shopify didn't always have its own system. Before 2021, it used different third-party services for logs, metrics, and traces.
But as it scaled, things started to get very expensive. The team also struggled to collect and share data across the different tools.
So they decided to build their own observability tool, which they called Observe.

As you can imagine, a lot of work from many different teams went into building the backend of Observe. But the UI was actually built on top of Grafana.
Sidenote: Grafana
Grafana is an open-source observability tool. It focuses on visualizing data from different sources using interactive dashboards.
Say you have a web application that stores its log data in a database. You give Grafana access to the data and create a dashboard to visually understand the data.
Of course, you would have to host Grafana yourself to share the dashboard. That's the advantage, or disadvantage, of open-source software.
Although Grafana is open-source, it allows users to extend its functionality with plugins. This works without needing to change the core Grafana code.
This is how Shopify was able to build Observe on top of it. And use its visualization ability to display their graphs.
Observe is a tool for monitoring and observability. This article will focus on the metrics part.
Although it has 5.6 million active stores, at most, Shopify collects metrics from 1 million endpoints. An endpoint is a component that can be monitored, like a server or container. Let me explain.
Like many large-scale applications, Shopify runs on a distributed cloud infrastructure. This means it uses servers in many locations around the world. This makes the service fast and reliable for all users.
The infrastructure also scales based on traffic. So if there are many visits to Shopify, more servers get added automatically.
All 5.6 million stores share this same infrastructure.
Shopify usually has around a hundred thousand monitored endpoints. But this could grow up to one million at peak times. Considering a regular company would have around 100 monitored endpoints, 1 million is incredibly high.
Even after building Observe the team struggled to handle this many endpoints.
More Metrics, More Problems
The Shopify team used an architecture for collecting metrics that was pretty standard.
Kubernetes to manage their applications and Prometheus to collect metrics.
In the world of Prometheus, a monitored endpoint is called a target. And In the world of Kubernetes, a server runs in a container that runs within a pod.
Sidenote: Prometheus
Prometheus is an open-source, metrics-based monitoring system.
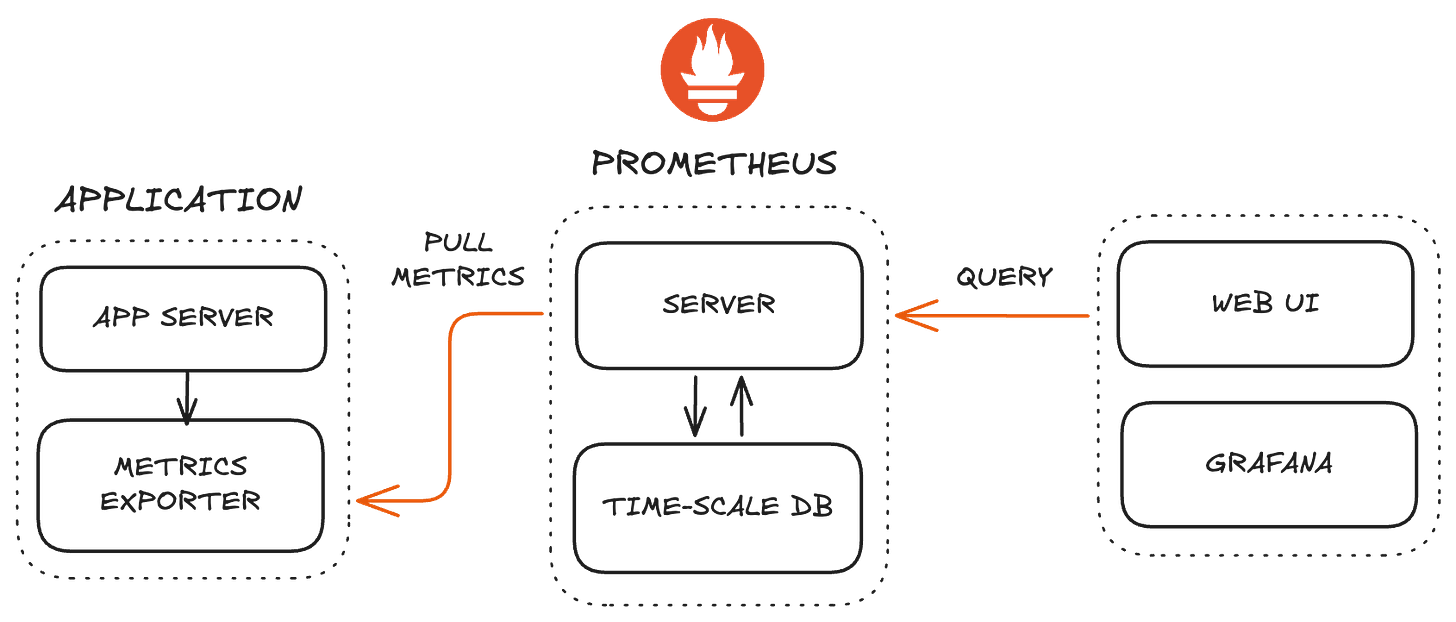
It works by scraping or pulling metrics data from an application instead of the application pushing or giving data to Prometheus.
To use Prometheus on a server, you'll need to use a metrics exporter like prom-client for Node.
This will collect metrics like memory and CPU usage and store them in memory on the application server.
The Prometheus server pulls the in-memory metrics data every 30 seconds and stores it in a time series database (TSDB).
From there, you can view the metrics data using the Prometheus web UI or a third-party visualization tool like Grafana.
There are two ways to run Prometheus: server mode and agent mode.
Server mode is the mode explained above that has the Prometheus server, database, and web UI.
Agent mode is designed to collect and forward the metrics to any storage solution. So a developer can choose any storage solution that accepts Prometheus metrics.
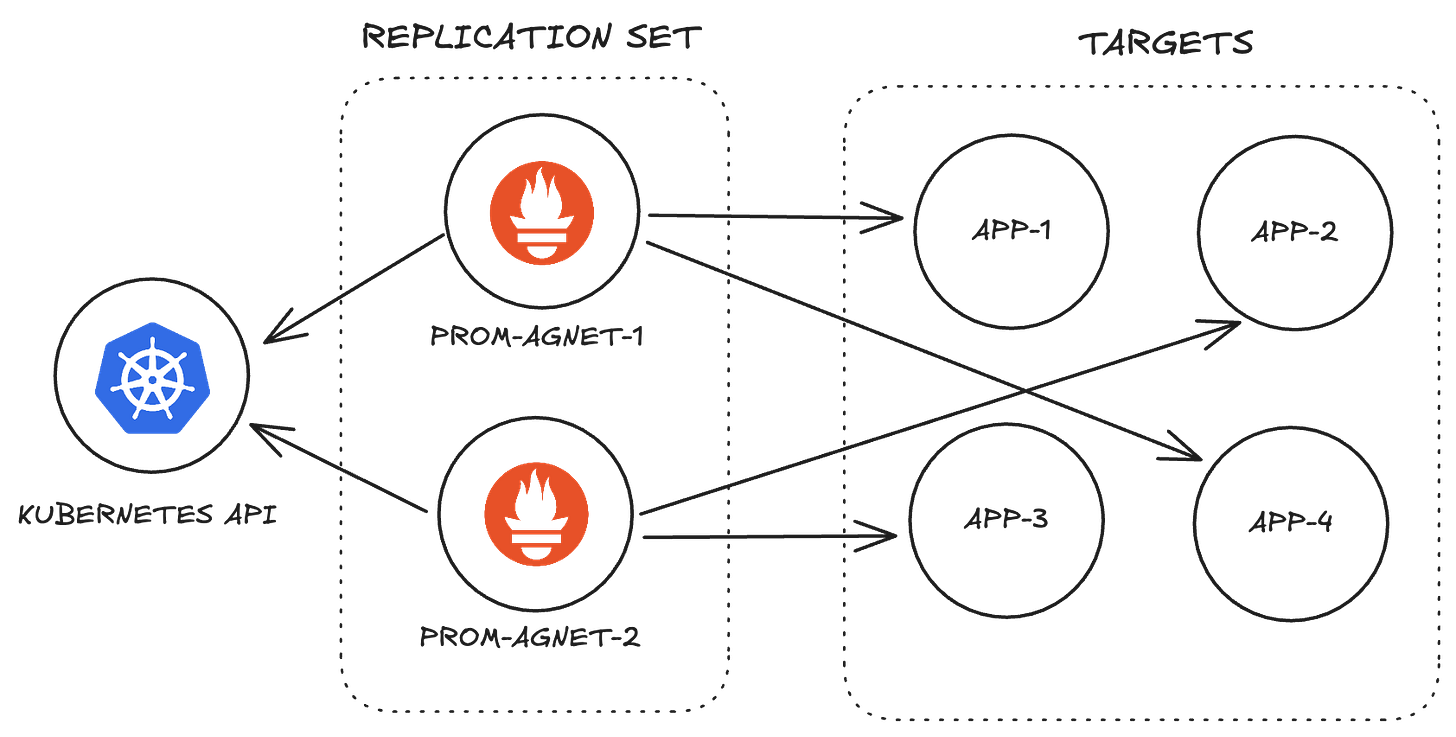
The team had many Prometheus agent pods in a replication set. A replication set makes sure a specific number of pods are running at any given time.
Each Prometheus agent would be assigned a percentage of total targets. They use the Kubernetes API to check which targets are assigned to them.
Then search through all the targets to find theirs.
You can already see what kind of problems would arise with this approach when it comes to scaling.
1. Lots of new targets could cause an agent to run out of memory and crash.
2. Distributing targets by percentage is uneven. One target could be a huge application with 100 metrics to track. While another could be small and have just 4.
But these are nothing compared to the big issue the team discovered.
Around 50% of an agent's resources were being used just to discover targets.
Each agent had to go through up to 1 million targets to find the ones assigned to them. So, each pod is doing the exact same piece of work which is wasteful.
To fix this, the team had to destroy and rebuild Prometheus.
Breaking Things Down
Since discovery was taking up most of the resources, they removed it from the agents. How?
They went through all the code for a Prometheus agent. Took out the code related to discovery and put it in its own service.
But they didn't stop there.
They gave these discovery services the ability to scrape all targets every two minutes.
This was to check exactly how many metrics targets had so they could be shared evenly.
They also built an operator service. This managed the Prometheus agents and received scraped data from discovery pods.
The operator will check if an agent has the capacity to handle the targets; if it did, it will distribute them. If not, it will create a new agent.
These changes alone reduced resource usage by 33%. A good improvement, but they did better.
The team had many discovery pods to distribute the load and for the process to keep running if one pod crashed. But they realized each pod was still going through all the targets.
So they reduced it to just one pod but also added what they called discovery workers. These were responsible for scraping targets.
The discovery pod will discover targets then put the target in a queue to be scraped. The workers pick a target from the queue and scrape its metrics.
The worker then sends the data to the discovery pod, which then sends it to the operator.
Of course, the number of workers could be scaled up or down as needed.
The workers could also filter out unhealthy targets. These are targets that are unreachable or do not respond to scrape requests.
This further change reduced resource use by a whopping 75%.
Wrapping Things Up
This is a common pattern I see when it comes to solving issues at scale. Break things down to their basic pieces, then build them back up.
All the information from this post was from a series of internal YouTube videos about Observe that were made public. I'm glad Shopify did this so others can learn from it.
Of course, there is more information in this video than what this article provides, so please check it out.
And if you want the next Hacking Scale article sent straight to your inbox, go ahead and subscribe. You won't be disappointed.
One final thing. If you’re thinking of self-hosting Prometheus, it’s actually cheaper and easier to use Better Stack. Don’t believe me? Check this out.
PS: Enjoyed this newsletter? Please forward it to a pal or follow us on socials (LinkedIn, Twitter, YouTube, Instagram). It only takes 10 seconds. Making this one took 20 hours.
Reading this email in gmail? Drag it to the Primary tab and never miss the next one.


